Steps, screenshots and video
Each test case of a run has its own tab. It shows every step with its result and evidence, lets you switch between data iterations and retries, and links on to the screens where you fix things.
In short
On this page you can
- Switch between a test case’s iterations (Run) and attempts (Retry).
- Read each step’s status, log, Total and Actual time and screenshot.
- Open Log Detail for the full message, API response and AI notes.
- Turn the screenshots into a video with Create Video, or play the device recording.
- See the variables steps saved, a Network step’s calls, and a device’s metrics and crashes.
How to use it
- Click the test case’s tab, or its row in the Summary’s Test cases table.
- Pick the iteration under Run and the attempt under Retry, if shown.
- Find the red step in the table and click its row to open Log Detail.
- Use Next step and Previous step to read around the failure.
- Click AI Analyze, or Task to open a task with the evidence.
Test case tabs#
Next to Summary, the tab strip has one tab per test case, in pipeline order. Each tab has a status icon in a small circle: passed (✓), failed (✕), running (▶, pulsing), passed with warnings (⚠) or not started (grey). Hover a tab for its full name and status. With many test cases the strip scrolls; Summary stays pinned on the left.
While the run is going, a tab’s status comes from its test case runs, so a test case shows as running until its last attempt ends. After the run, it comes from the steps. See Case tab status.
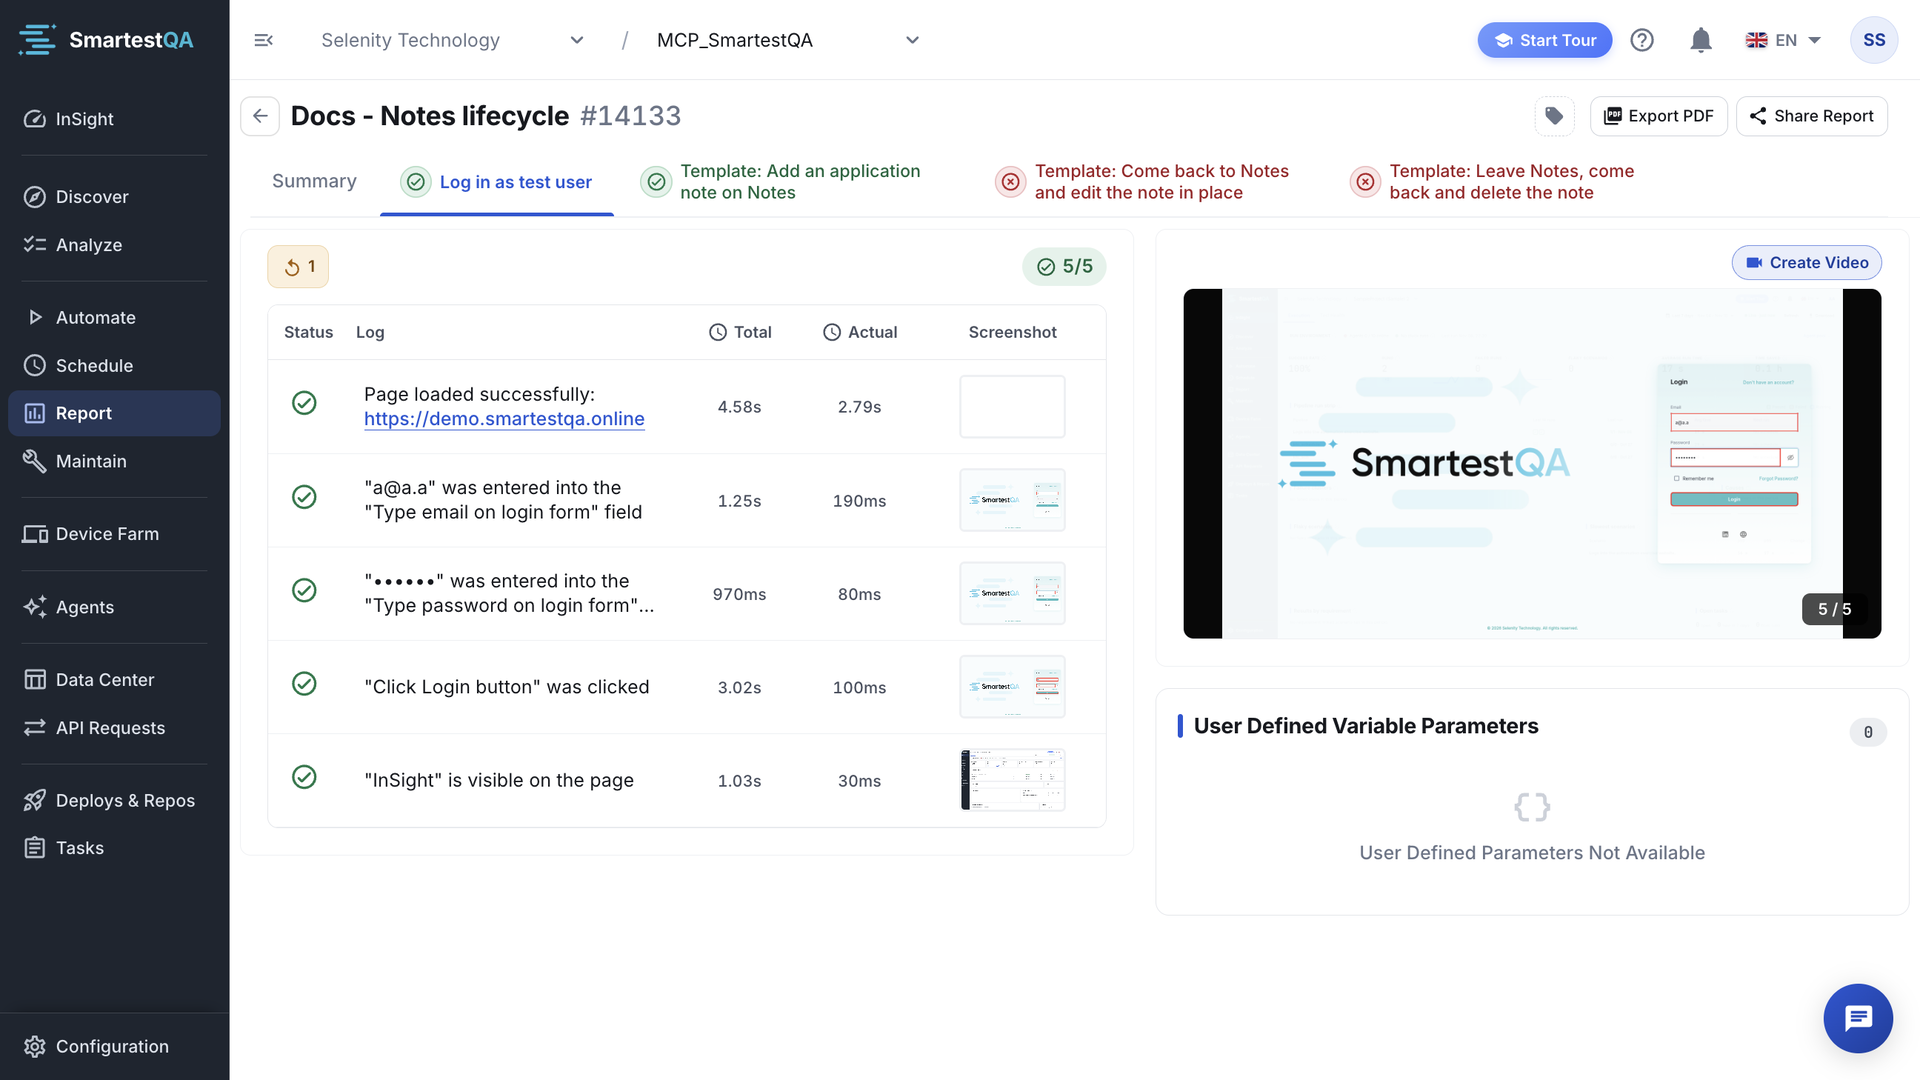
Iterations, retries and execute count#
The bar above the step table chooses which execution of this test case you are looking at.
| Control | Shown when | What it does |
|---|---|---|
| Execute count chip | The pipeline sets how often this test case runs | Shows the count, or for a data-source loop the number of rows and the data source name (3 · login_users). Tooltip: “Execute count for this test case”. |
| Run | The test case ran more than once (data rows, execute count, several devices) | Pick iteration 1, 2, 3… When the same test case ran on different devices, the options are device names, with “· 2” for a second run on the same device. Arrow keys move between options. |
| Retry | An iteration failed and was retried automatically | Pick First Attempt, Retry 1, Retry 2… Each option shows ✓ or ✕ for its result. |
The right of the bar shows a chip with passed steps out of all steps of the chosen attempt, for example 12/14 (see Steps chip). When the attempt has failed steps, two buttons appear: Task and AI Analyze. Mobile device runs also show Device Metrics and Crashes here.
The step table#
| Column | What it shows |
|---|---|
| Status | ✓ success, ✕ failed, ⚠ warning, ⌛ still running. A failed step that AI has analyzed also shows its verdict chip. |
| Log | The step’s message from the runner. Web addresses in it are links. A step that AI turned into an action candidate shows Convert to Action. |
| Total | From the start of the step until its result was recorded: finding the element, waiting, acting and taking the screenshot. |
| Actual | The time the action itself took, where the step measures it (for example the browser time, a wait, a database query, a JMeter run). Empty when not measured. |
| Screenshot | A thumbnail. Click it to browse all screenshots of this attempt. |
- Templates. Steps that came from a template are grouped under a Template header with “{count} steps”. Expand it to see them.
- Several rows for one step. One step can write more than one row, for example the action, an AI analysis and an auto-heal note. All rows are shown, in time order.
- Durations show as
350ms,2.41s,1m 5s,1h 2mor days. - Nothing logged. “No logs found for this execution” means the attempt wrote no steps. If Skip Successful Logs was on in the pipeline, only failed steps were logged.
Log Detail#
Click any step row to open Log Detail.
Read the message and the screenshot
Log Message has the full text (“No log message available” if the step wrote none). Screenshot shows the page at that moment; Click to enlarge opens Screenshot Preview, which has Open in new tab and closes with Esc.
Check the status and durations
Status, Total and Actual, as in the table.
Read the response (API, Kafka and Network steps)
API Response shows what the call returned. Long text can be expanded and collapsed. For a Network step it is a network report instead.
Read the AI notes
If the step was analyzed: the verdict with its confidence, AI Root Cause, Evidence and Suggestions.
Move around the failure
Previous step and Next step walk the rows in table order and wrap around at the ends.
Screenshots#
Clicking a thumbnail opens Screenshots, a viewer for every screenshot of the attempt with Previous and Next (“Use arrow keys to navigate”). Each image shows its step’s log under it.
Whether every step has a screenshot depends on the pipeline: with Screenshot on Fail only failed steps are captured. A thumbnail that cannot load shows “No screenshot available”.
Video#
The panel to the right of the steps (below them on narrow screens) shows the screenshots as a slideshow and offers a video.
| Run | Video |
|---|---|
| WEB, DESKTOP, mobile on your agent or the Device Farm | Click Create Video. Your browser turns the screenshots into a video, one second per screenshot (“Processing {current} of {total} screenshots”). It is not saved: create it again next time, or save it from the player. |
| MOBILE on AWS Device Farm or BrowserStack | The provider’s recording of the device plays directly, labelled with the device, for example “Pixel 7 (Android 14)”. |
- While the run is going, the panel says “Please wait for the test to complete”.
- When Video Recording was off in the pipeline, there is no Create Video button.
- “No screenshots found” means the attempt has no screenshot to build from.
AI Failure Analysis card#
Under the video, the AI Failure Analysis card lists the analyzed failed steps of this test case, “{n} steps analyzed”, each with its verdict, confidence and root cause. Click one for the full analysis. See Read the result.
User Defined Variable Parameters#
Steps can save values into variables during a run, for example an order number read from the page or an API response field. This card lists them for the chosen run: Step, Variable and its value (Empty when nothing was saved). Click a row for Variable Parameter Details. While the test case is running the card refreshes every few seconds. “User Defined Parameters Not Available” means this test case saved no variables.
Use it to see what a later step actually received when it failed with a wrong value.
Network report (Network step)#
A Network step records the browser’s calls. In Log Detail it shows the Network report instead of a raw response: a summary of calls, failed calls, JavaScript errors and console messages, then the matching calls with their request and response headers and bodies. Filters show only failed calls or only errors. Long bodies are marked “Shortened to fit the report”.
- Convert to API steps opens Network → API steps: pick requests and they are added as API Request steps to a new test case in the same folder, ready for a JMeter test. Masked secrets in bodies become
{{fieldName}}variables that you fill in. It needs a Network step run in “List” mode; otherwise “There are no requests to convert in this report…”. - A link opens the same test case in Maintain › Network Calls (“Opens this test case in Maintain > Network Calls”).
Convert to Action (AI steps)#
When an AI step passed and found a locator, its row shows Convert to Action (“Opens this step in Maintain > AI Steps”). It takes you to Maintain › AI Steps with that step selected, where you turn it into a regular action that runs without AI. Steps that were already converted do not show the button.
Open a task from a failure#
Click Task
Shown when the chosen attempt has failed steps. Tooltip: “Create a defect task”.
Fill in the task
Name, priority, status and type are required (“Please fill in all required fields.”). Assign it to a user of your company.
“Task created successfully. You can check it on the Tasks page.”
Pipelines with Automatic Task on create tasks for failures by themselves; those count as “from runs” in InSight › Open tasks.
Device Metrics and Crashes (MOBILE)#
For a mobile run, two buttons sit above the step table. Their data comes from SmartTest Device Farm sessions, so they are empty for runs on other providers or your own device. Device Metrics shows the device’s temperature, battery, memory and CPU during the run. Crashes lists crashes, ANRs (app not responding) and native events, with a count on the button. Both follow the device of the chosen Run; the dialog subtitle names it, for example “Pixel 7 · 14”.
Load test steps#
A test case with JMeter or k6 steps shows the load test report in its tab, live while it runs. See Load test results.
If something goes wrong#
Didn’t find your answer?Write to support with your project name and what you see on screen.
info@smartestqa.ai