Run summary, export and share
When you open a run, the header names it and holds the export, share and tag actions, and the Summary tab tells you in one screen whether the run passed and which test cases need you.
In short
On this page you can
- Read the run’s verdict, start time, duration and who started it.
- Filter the test cases to Failed or Passed on retry and see each failure reason.
- Open the run’s server error logs with View Logs.
- Check the exact settings the run used under Pipeline Preferences.
- Download a PDF, email it with Share Report, or tag the run.
How to use it
- Open a run from the Reports list; it starts on the Summary tab.
- Read the result card, then click a status chip to filter the Test cases table.
- Click a test case row to open its steps in its own tab.
- When the run has finished, click Export PDF or Share Report.
- Add a tag with + next to the buttons so you can filter for this run later.
The report header#
The header stays at the top while you scroll. It shows the pipeline name and the report ID (Nightly regression #482), a back arrow to the list, and the actions for this run.
- Tags: up to two tags are shown, then a count. + opens Edit Tags. See Tags.
- Export PDF: downloads the PDF report. See Export PDF.
- Share Report: emails the PDF. See Share Report.
- Manual pipelines only: Created by and Last Run by, each with a name and a date.
Until the run has finished, the three actions are greyed out with “Please wait for execution to complete”. A run counts as finished when SmartestQA has closed it, or when nothing has moved for 2 hours. Below the header, the tab strip has Summary pinned on the left and one tab per test case; see test case tabs.
The Summary tab#
For web, mobile and desktop runs the Summary has five parts, in this order. Manual pipelines and load tests have their own summaries: see Manual pipeline runs and Load test results.
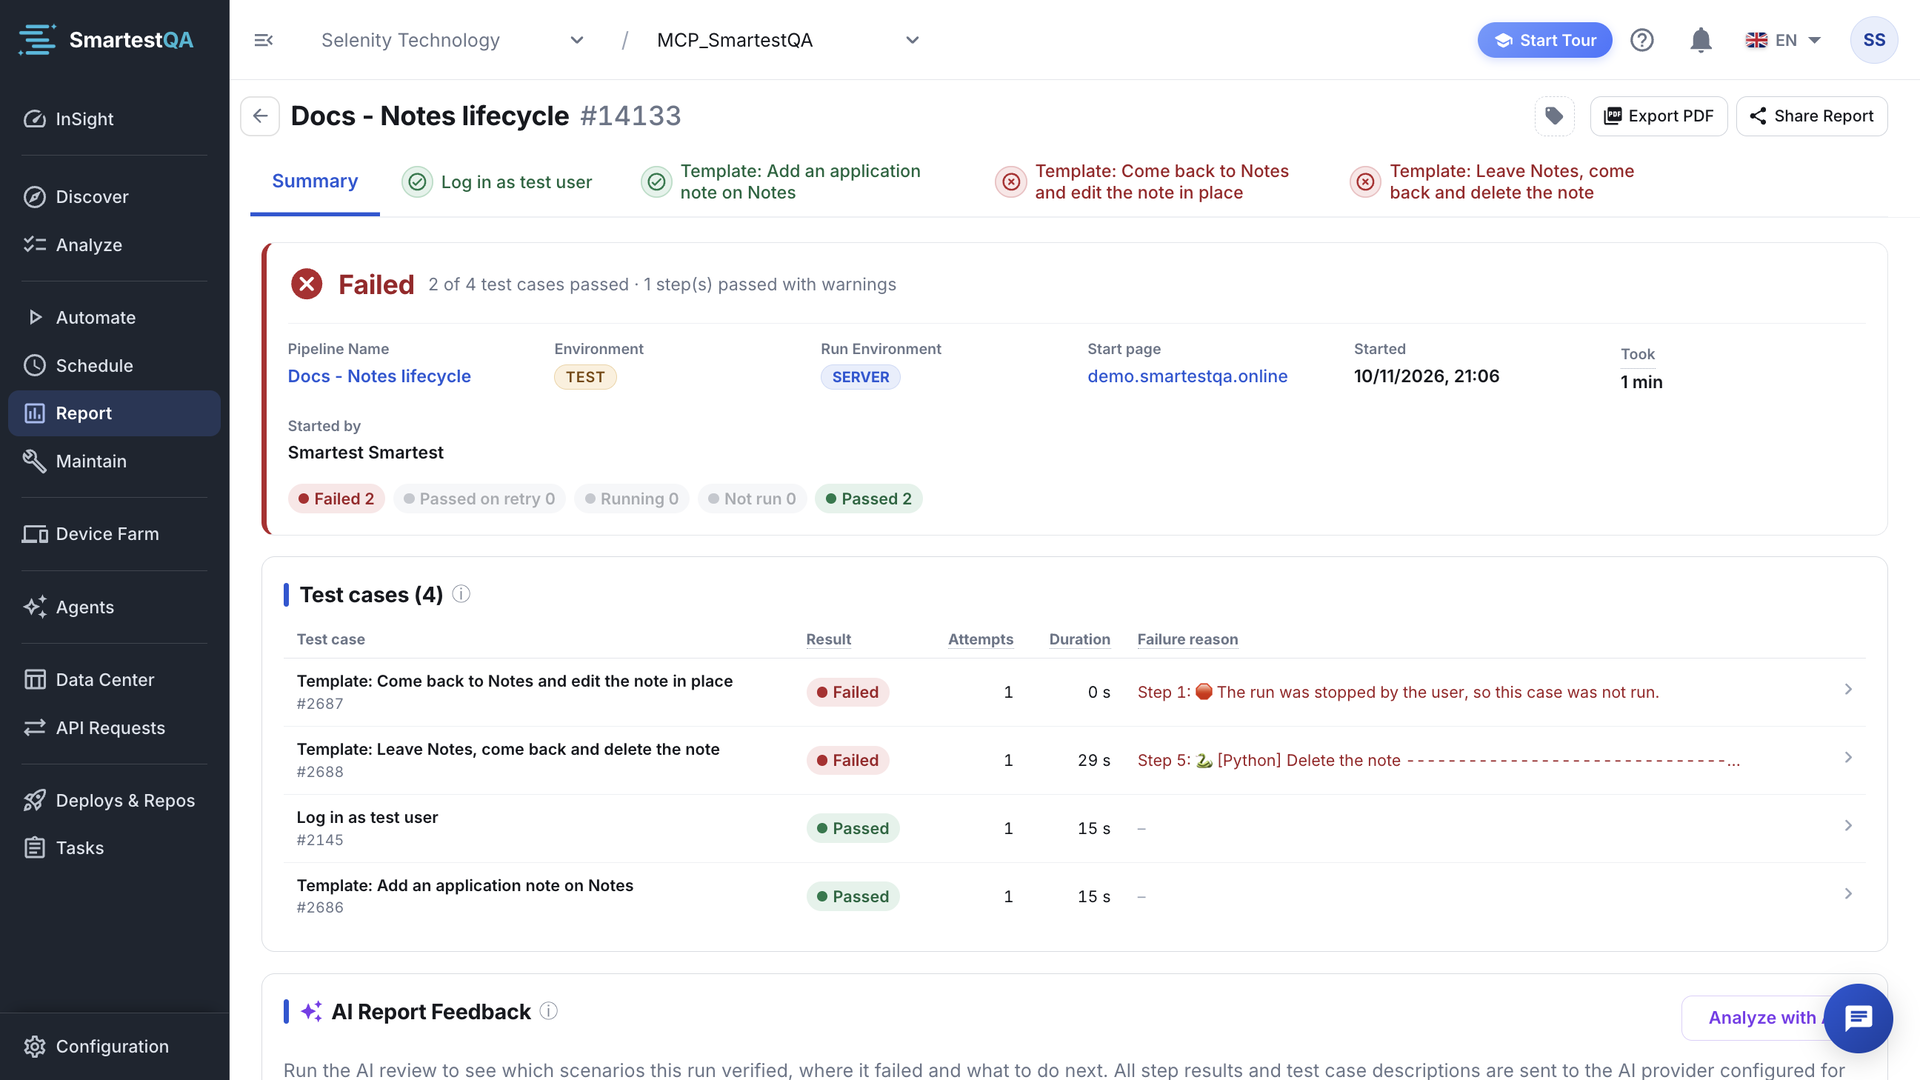
1. The result card#
The large word is the verdict: Passed, Passed with warnings, Failed, Running, or No test case ran. Hover it for the rule. The line under it says why, for example “7 of 8 test cases passed · 1 needed a retry · 2 step(s) passed with warnings”. How the verdict is decided: Run verdict.
| Fact | Meaning |
|---|---|
| Pipeline | The pipeline name. |
| Environment | DEV, TEST or PRP, the start page environment. |
| Run Environment | Server, Agent, Local or the mobile provider. |
| Started | When the first test case started. |
| Took | Wall-clock time of the whole run; “so far” while it runs. |
| Started by | The user who started it. |
| Start page | The address the run opened, as a link (web). |
With more than one test case, status chips follow: Failed, Passed on retry, Running, Not run and Passed, each with a count. Click a chip to show only those test cases in the table below; click it again to show all. Chips with 0 are dimmed.
2. Test cases#
One row per test case of the run, problems first: failed, passed on retry, running, not run, passed. When every test case passed, the slowest is on top instead.
| Column | What it shows |
|---|---|
| Test case | The name, plus “· {n} iterations” when it ran more than once. |
| Result | The last attempt decides. Passed on retry means it failed first and passed on an automatic retry. See Test case state. |
| Attempts | How many times the test case ran in this run, retries and iterations included. |
| Duration | Time of the last attempt, summed over its iterations. |
| Failure reason | The first failed step of the last attempt, as “Step 4: …” (up to 400 characters). Open the test case for details when no step message is available. |
Type in Search test cases to filter by name. Above 25 test cases the table pages. Click a row to open that test case’s steps tab.
3. AI Report Feedback#
An AI review of the whole run: which scenarios it verified, why the failures happened, and what to do next. It runs when you click Analyze with AI. See AI Report Feedback.
4. Last 5 Error Logs#
Shown only when a test case failed. It lists the five newest error lines that SmartestQA’s servers wrote while handling this run: dispatching it, talking to the runner, saving results. These are not the steps’ own logs; those are in the test case tabs.
Open all logs
Click View Logs. The Test Execution Logs dialog lists Date/Time, Level, Message and Exception.
Filter
Choose a level (INFO, SUCCESS, WARNING, ERROR, DEBUG). Clear Filters resets. While the dialog is open it refreshes every 5 seconds.
Error logs are kept for 5 days
Server logs older than 5 days are deleted every night. After that, this box shows “No error logs” even for a failed run. The step logs, screenshots and the rest of the report stay.
5. Pipeline Preferences#
A collapsed card with the settings this run actually used, frozen at start: Test Management (parallel execution, threads, continue on failure, retry count, automatic task, screenshot on fail), browser and display settings, Environment Urls (environment, start page URL and the actual URL opened), AI Options, Advanced Settings (skip successful step logs, video recording, timeouts, email notification) and, for mobile, the device provider settings. The AI API key is never shown. Use it to answer “was retry on?” or “which browser was it?” without opening the pipeline, which may have changed since.
Manual pipeline runs#
A manual pipeline records results that testers enter by hand. Its report has no test case tabs; the Summary shows:
- Report Information: project, pipeline (with Go To Pipeline), run environment, created by, start and end date.
- Total Test Cases, Executed Test Cases, Successful Test Cases, Failed Test Cases, Pending Test Cases. See Manual counts.
- Success - Failed Ratio and Run Ratio pie charts. Click a slice to list those cases; click a case to go to it in Automate after confirming “Do you want to go to the Automate page ?”.
- Total Modules with the number of cases per module, and the Module-Based Bar Chart.
Export a PDF#
Wait for the run to finish
Export PDF is enabled once the run has finished.
Load tests: pick the view first
If the run has JMeter results, the PDF uses the view you have open in the JMeter section (overall or per sampler, and the services you show). See Load tests in the PDF.
Click Export PDF
The button shows Exporting while the server builds the file.
A PDF named after the pipeline downloads, and “PDF exported successfully” appears.
| The PDF contains | Details |
|---|---|
| Header | Pipeline name and report ID, project, start and end time, who started it, run environment, environment, start URLs. |
| Counts | Total, Executed, Successful, Failed, Pending test case runs. |
| Settings | The pipeline preferences, without cloud credentials; the scheduled test cases. |
| Error logs | The last 5 error logs, as on screen. |
| Steps | Every test case with its step table, attempt by attempt; failed-step screenshots in their own section. |
| Load tests and AI | The JMeter section in the selected view, and the stored AI Report Feedback, if any. |
The PDF is written in your interface language (English, Turkish, German, Spanish or Arabic). Mobile projects get a mobile layout. Step-table thumbnails stop after 60 images, and images larger than 4 MB are left out.
Share a report by email#
Click Share Report
Enabled once the run has finished.
Enter one address
Type the recipient in Email. An address without
@or a domain shows “Invalid email address” and Send stays disabled. Press Enter or click Send.“Email sent successfully!” The recipient gets a short email with the same PDF attached.
- The recipient does not need a SmartestQA account; everything is in the PDF.
- The email is sent from SmartestQA’s platform address. Ask the recipient to check spam the first time.
- To send to several people, send once per address, or use the pipeline’s automatic email (below).
- There is no public link to a report. A
/report/<id>address only works for people with access to the project.
Automatic emails after each run#
A pipeline can email its PDF report when a run finishes, every time (Always) or only when it fails (On Failure), to the addresses in Email To and Email CC (several addresses separated by ;). You set this in the pipeline’s preferences in Schedule, or as a project default. Automatic emails are always in English.
Tag a report#
Open Edit Tags
Click + next to the tags in the header. It is enabled once the run has finished.
Pick or create tags
Search the existing tags, tick the ones you want, or create a new one with a name and a colour.
The tags show in the header. In the list, filter on them with the filter icon’s Include and Exclude.
Tags belong to the run, not to the pipeline, so tag “release-4.2” on the one run that matters.
If something goes wrong#
Didn’t find your answer?Write to support with your project name and what you see on screen.
info@smartestqa.ai