- Docs
- Build tests
- InSight
InSight
InSight is the first item in the main menu and the page you land on after login. Its Execution tab tells you how your runs went; its Test Health tab tells you how much of your application your tests really prove.
In short
On this page you can
- See success rate, runs, failed runs, flaky test cases, run time and time saved for a period.
- Find the failures that share one cause, and the slowest and least stable test cases.
- Measure coverage in four pillars and one automation maturity score.
- Get the next three things to fix, each with a ready MCP prompt.
- Download Excel or PDF, and save Test Health snapshots.
How to use it
- Open InSight; pick the Execution or Test Health tab.
- On Execution, choose the Period and read the six summary cards.
- Go down to Failure clusters and Flaky scenarios, and open the worst one.
- On Test Health, read the pillars, then work through Fix these first.
- Click Save report before a release to keep the picture.
At a glance
- Where
- Main menu › InSight, the first item. It is also the page you see after login. Tabs: Execution, Test Health.
- Who
- Everyone with access to the project. Admin and User see exactly the same numbers.
- You need
- Execution: runs in the chosen period. Test Health: requirements from Analyze, test cases and pipelines.
- Time
- Numbers are calculated when you open the tab or click Refresh, in a few seconds.
- Produces
- Excel and PDF downloads, saved Test Health reports, ready prompts for AI assistants.
- Reads from
- Run reports, requirements, test cases, pipelines and schedules, actions, tasks, agents and AI agent runs.
- Project types
- The same for WEB, MOBILE and DESKTOP. Load tests count as runs in Execution and are left out of Test Health’s scenario funnel.
Start from your question#
I want to…
Something is wrong
Where InSight fits#
The main menu is the order of work. InSight sits above it and reads every step: Test Health measures how far Discover, Analyze, Automate and Schedule have got, and Execution measures what Schedule’s runs produced in Report.
- 1DiscoverActions used by tests
- 2AnalyzeRequirements to prove
- 3AutomateScenarios that check results
- 4SchedulePipelines and timers
- 5ReportRun results
- 6MaintenanceRepairs to review
Use Report for one run. Use InSight for the pattern across runs and for the state of the whole project.
Why use it#
- One answer to “are we green?” The success rate, failed runs and the pipeline run strip show it per period and per pipeline.
- Fix causes, not symptoms. Failure clusters group failed steps with the same error, so twelve red test cases can turn out to be one broken login.
- Find the tests nobody trusts. Flaky scores and the trust checks find test cases that flip, or pass without checking anything.
- Coverage you can defend. A requirement only counts as covered when a scenario that checks a result passed on its last run.
- Work for you or your AI assistant. Every recommendation has a Copy MCP prompt button with the task already written.
The building blocks#
- Scenario
- InSight’s word for a test case. Templates and test cases tagged
plannedare not counted as real scenarios in Test Health. - Run
- One pipeline run, or one test case run started on its own. A pipeline run with ten test cases is one run.
- Scenario run
- One execution of one test case inside a run. The success rate is counted over these.
- Sub-requirement
- One behaviour from Analyze that needs a test. Test Health counts coverage over sub-requirements.
- Proving scenario
- A scenario with at least one step that checks a result (assertion, visibility check with text, validation-mode AI step, API extractor, assert-text step, load test), directly or in a template it calls.
- Pillar
- One of four coverage percentages: requirement, scenario, risk and action coverage.
- Maturity
- A weighted average of the four pillars, 0–100.
- Failure cluster
- Failed steps whose error messages are the same once numbers and quoted values are ignored.
- Flaky score
- How often a scenario’s result flips between runs: 0 stable, 1 flips every time.
- Period
- The date range of the Execution tab. Each number is compared with the period of the same length just before it.
The screen#
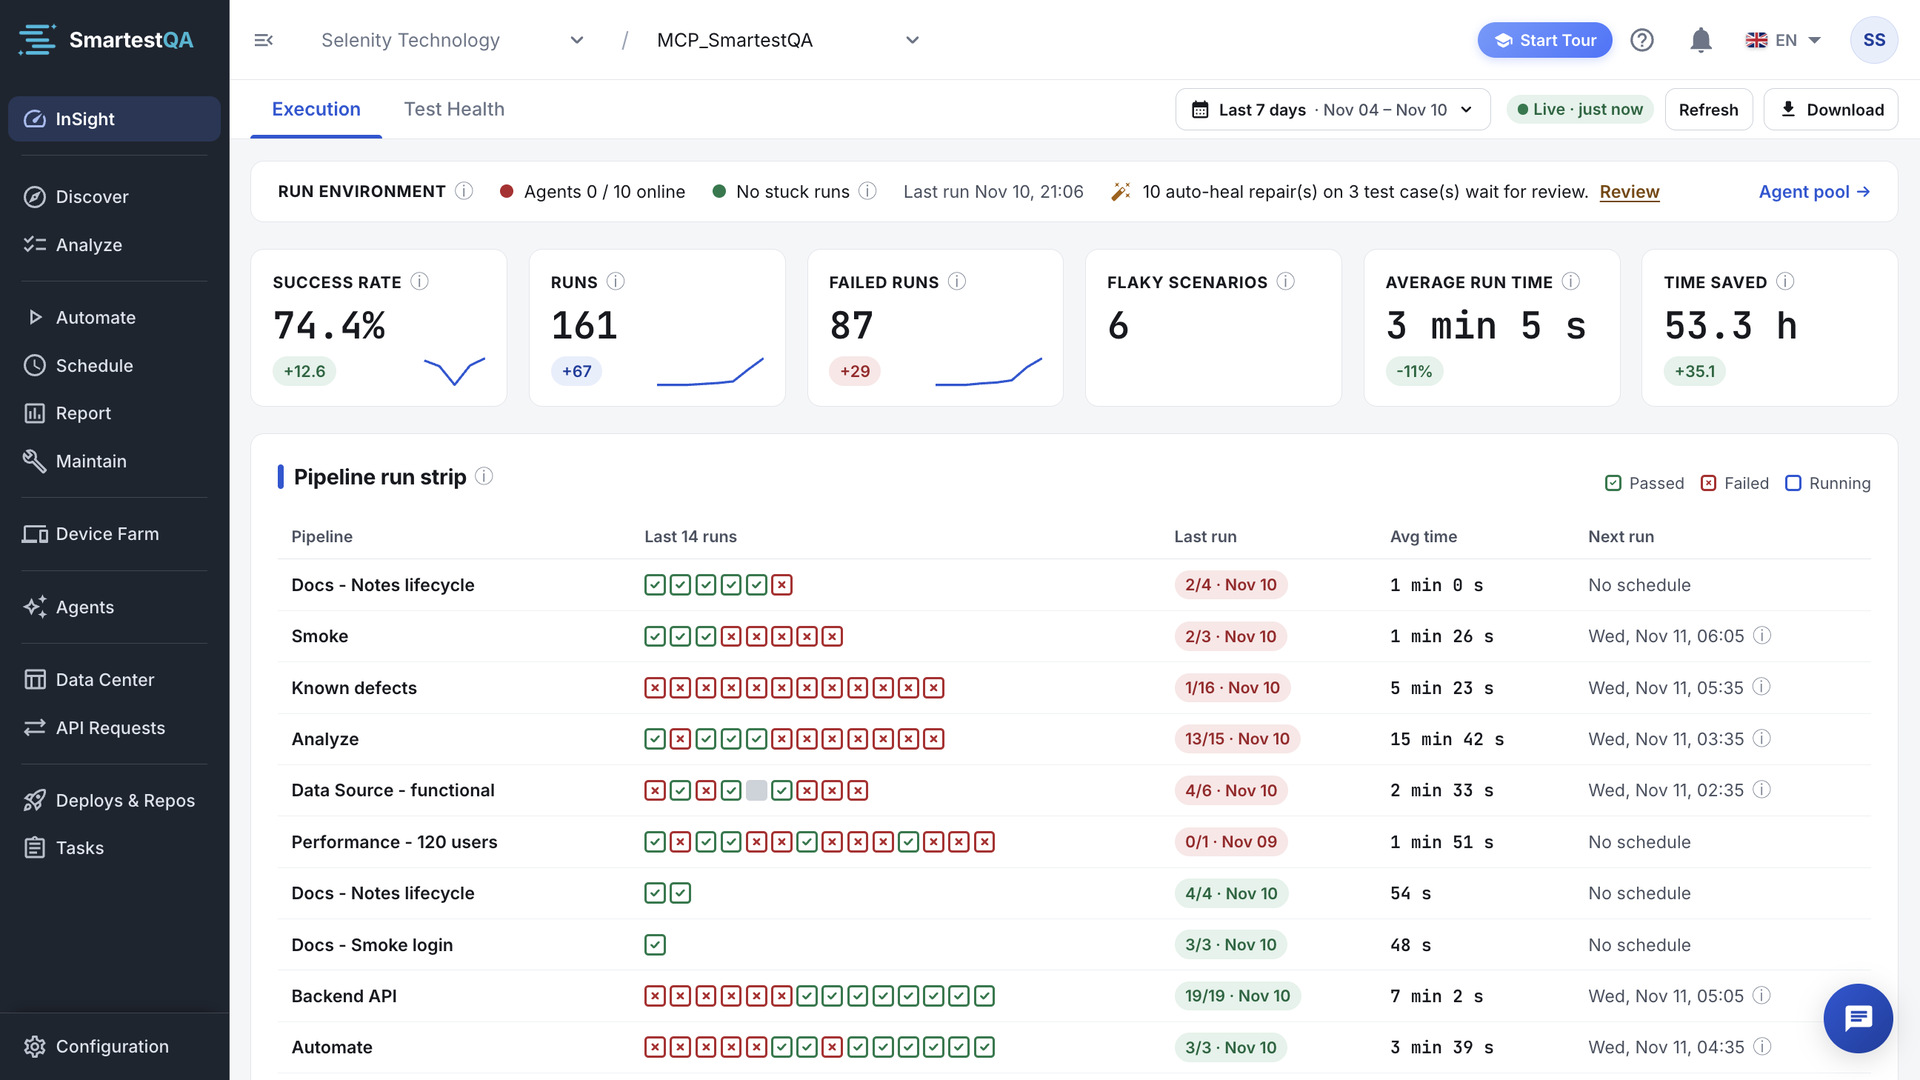
The tab row stays at the top while the content scrolls. Its right side holds the tools of the open tab.
| Tab | Answers | Tools in the tab row |
|---|---|---|
| Execution | How did our runs go in this period? What failed, why, what is flaky or slow? | Period picker, live chip, Refresh, Download (Excel or PDF) |
| Test Health | How much of the application do our tests prove, and what should we fix first? | Live chip, Refresh, Save report, Reports, PDF |
- Live chip. Live · just now or Live · {n} min ago: how old the numbers are. They do not update by themselves; click Refresh.
- Which tab opens. The one in the address (
?tab=executionor?tab=health), otherwise the last one you used in this browser, otherwise Execution. A project with AI agents opens on Test Health the first time. - Auto-heal reviews. When repairs wait for review, a line says “{n} auto-heal repair(s) on {m} test case(s) wait for review.” with Review, which opens Maintain › Auto-heal. It sits in the Run environment row on Execution and at the top of Fix these first on Test Health.
Video transcript
InSight opens on Execution: what ran in the selected period, and how it went. The period sets the window for every number on the page. Six cards sum it up: success rate, runs, failed runs, flaky scenarios, average run time and time saved. The pipeline run strip shows the last 14 runs of each pipeline. A row of red is where to look. Failure clusters group failed steps that broke for the same reason. Test Health asks a different question: how much of the product is really proven? Automation maturity is one score built from four pillars, each with an 80% target. Fix these first lists the three actions that raise the score most. The coverage funnel shows where requirements drop out on the way to a passing test. Modules × coverage ranks every module by risk, coverage and last results.
Before you start#
| To see | You need | Where you get it |
|---|---|---|
| Execution numbers | Pipeline runs, or test cases run on their own, in the period. Dry runs are not counted. | Schedule; Quick Start, step 6 |
| Requirement and risk coverage | Main requirements with sub-requirements, linked scenarios, severities | Analyze |
| Scenario coverage, pipeline maturity | Scenarios in pipelines that have run; schedules | Automate and Schedule |
| Action coverage | Actions used by test steps | Discover › Actions |
| Agents online, stuck runs | Agents installed for the company | Install an agent |
Other ways to see the same picture#
| Way | Best when | You get |
|---|---|---|
| InSight | You want the whole project at a glance | Execution and Test Health, live |
| Report | You need the details of one run | Steps, screenshots, logs, AI verdicts |
| Discover › Setup Roadmap | You are still setting the project up | The next setup step, see Progress meters |
| Excel / PDF download | A status meeting or an audit | One sheet per Execution section, or a print of the tab |
| AI assistant through MCP | You work from your IDE or chat | The Test Health numbers and the open work as a list. See MCP. |
Best practices#
Do
- Look at Execution every morning with Last 7 days; compare weeks with the deltas.
- Fix the biggest failure cluster first: it is usually one cause.
- Give every scenario at least one step that checks a result.
- Link every scenario to a sub-requirement and every risky sub-requirement to a scenario.
- Save a Test Health report before each release.
Don’t
- Read the success rate without the number of runs next to it.
- Count “Passed” as proof: a scenario that checks nothing passes too.
- Leave runs stuck in Running; they distort run time and the strip.
- Chase a maturity score by adding scenarios that do not check results.
- Expect InSight to refresh itself; click Refresh after a run.
In this section#
The Execution tab: period, run environment, six summary cards, pipeline run strip, failure clusters, flaky and slow test cases, requirements, open tasks, weekly trend and downloads.
InSightTest HealthThe Test Health tab: four coverage pillars and maturity, Fix these first, funnels, modules, pipeline maturity, trust issues, gaps, traceability, stale tests, progress and saved reports.
InSightHow the numbers workFormulas and worked examples for every InSight number: success rate, runs, flaky score, run time, time saved, clusters, p95, pillars, maturity, funnels, levels and the classic view.
InSightTroubleshootingEvery InSight message and surprising number, with why it happens, what to check and how to fix it.
InSightFAQ, MCP & limitsQuestions and answers about InSight, how AI assistants use Test Health through MCP, and every list size and time window.
Didn’t find your answer?Write to support with your project name and what you see on screen.
info@smartestqa.ai