Dry run and live log
A dry run tries the saved test case once and shows every step live, with a screenshot, without writing a report. Use it while you build; put the test case in a pipeline when you want results you can keep.
In short
On this page you can
- Run the saved test case once with Dry Run, without a report.
- Choose Run on Server or Run on your Agent for web tests.
- Pick a local device or a Device Farm device for mobile tests.
- Follow every step live, with a screenshot per step.
- Diagnose a failed step from its message, locator and screenshot.
How to use it
- Click Save, then Dry Run next to it.
- Choose the run target and start.
- Watch the Test Run panel until it says Completed.
- Open the first red step: read the reason and look at its screenshot.
- Fix the step, save and dry run again; then add the test case to a pipeline.
Before you start#
- Save first. Dry Run is disabled while the test case has unsaved changes (“Please save the test case before running”). The dry run runs the saved test case.
- Python steps need code for your engine. Otherwise: “Selenium code is empty for Python step(s): …. Dry Run was not started.”
- Something to run on. Web needs nothing extra for Run on Server; your own agent for Run on your Agent. Mobile needs a device through your agent or Device Farm. Desktop needs the desktop agent on Windows or macOS. See Do you need an agent?
Start a dry run#
Click Dry Run
Click Dry Run, just left of Save at the bottom of the editor.
Choose the run target
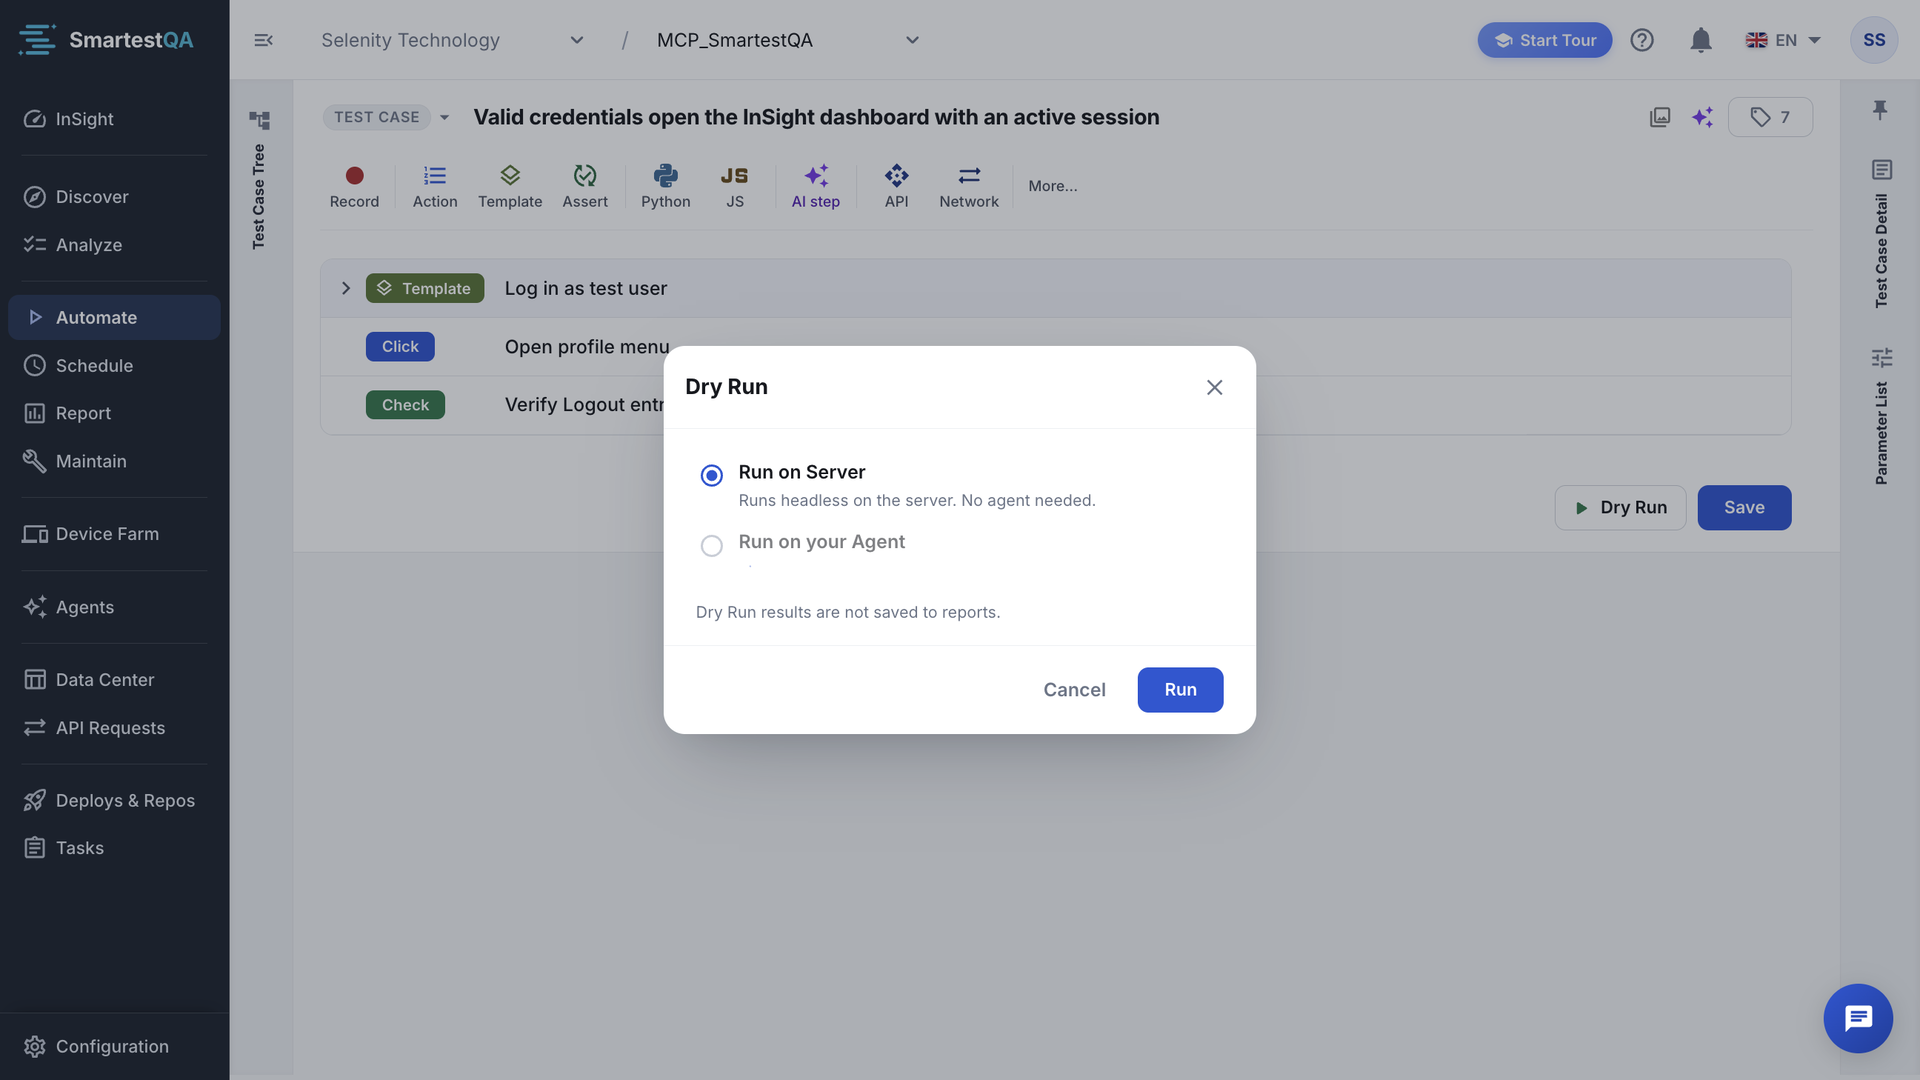
The Run target dialog depends on the project type; see the sections below.
Start
Confirm the target.
“Test execution started successfully” and the Test Run panel opens with the live log.
Web projects#
| Target | What it does | Use it when |
|---|---|---|
| Run on Server | “Runs headless on the server. No agent needed.” | Your app is reachable from the internet and you only need the log and screenshots. |
| Run on your Agent | “Runs on your computer; you can watch the browser.” Disabled when your agent is offline: “Your agent is offline. Start the agent app to use this option.” | You want to watch, your app is behind a VPN or firewall, or a step needs your network (database, mail server). |
The dialog selects your agent when it is online, otherwise the server. Its footer reminds you: “Dry Run results are not saved to reports.” A dry run on your agent always opens a visible browser; on the server it is always headless.
Mobile projects#
- Dry Run (local): “Runs on a local device/emulator on this machine.” Choose a device under Pick a device or Automatic (connected device). Under Application you can override the app package and activity for this run only: “Applies to this run only — not saved to the project settings.”
- Device Farm: a SmartTest Device Farm device, when your company has access to it. Control the device lets you tap on the device during the run (“Taps you make while the run is in progress can affect the test result.”).
- Appium must be running for local runs: “Appium server not found — Appium server must be running to execute mobile tests. Open a new terminal and run "appium" to start it.”
The device is chosen when you run, not stored in the project. Pipelines choose theirs in Schedule.
Desktop projects#
Desktop tests run only on an agent on the computer with the application, Windows or macOS. Choose the agent under Device (agent): This computer or a Remote device; offline agents are marked. With none installed: “No SmartTest-Desktop agent found. Install and start the desktop app on the computer where the application runs.”
Read the live log#
| Part | What it tells you |
|---|---|
| Status chip | Live while the run sends updates, Completed at the end, Disconnected when the connection to the live log dropped. |
| Progress | “Progress: p%” and “c / t steps completed”. See how they are counted. |
| Row 0 | “Open start page URL”: opening the start page (web). |
| Step rows | One per active step, in order, with a status badge, its messages and duration. Click a row to expand its details. |
| Show screenshot | The screenshot taken after the step. Dry runs take one for every step. |
| Watch screenshots as video | The screenshots in order as a slideshow (Video). |
| Result banner | “Test completed successfully!” or “Test failed”. |
| Badge | Meaning |
|---|---|
| PENDING | Not reached yet. |
| RUNNING | Running now. |
| SUCCESS | Done and passed. |
| HEAL | The control was not found with its locators; auto-heal is looking for it. |
| WARNING | Passed with a warning (for example a network step whose error rule is “warn”). Does not fail the test. |
| ERROR | The step did not pass. The live log shows both failed checks and execution errors as ERROR. |
| SKIPPED | Not run, because the test stopped at an earlier step. |
Messages follow the project’s locale (English, Turkish or German; other locales get English). Very long messages are cut at 4,000 characters.
Closing the panel#
A dry run cannot be stopped, not even by an AI assistant. Closing the panel asks “Close panel?”: “Test execution will continue running in the background. Are you sure you want to close only this live log panel?” Click Yes, close to close only the panel.
Video transcript
A test case is a list of steps. Before it goes into a pipeline, try it with a dry run. Dry Run asks where to run: on the server, headless with nothing to install, or on your own agent. Dry run results are not saved to reports. The Test Run panel follows the run live: progress, and a status for every step. When it ends, every step shows its result.
Diagnose a failed step#
Open the first red step
Later steps are usually SKIPPED because of it. Expand the row.
Read the message
Error messages have the form
<what failed>: <reason> | Locator: by=value | Detail: ….Look at the screenshot
Was the page the one you expected? Was a dialog, cookie banner or spinner in the way?
Fix and rerun
Change the value, the wait, the order or the locator (Action Detail), save and dry run again.
| Reason in the message | Usually means | Try |
|---|---|---|
| Element not found | The locator no longer matches, or the page was not the expected one | Check the screenshot; add a stable id or name locator in Action Detail |
| Timeout — element did not become ready in time | The page is slow, or something covers the control | Add a wait or a visibility check before the step |
| Element not clickable / not interactable | An overlay, a disabled control, or the control is off screen | Close the overlay with a step; check the step order |
| Element is no longer valid on the page (stale) | The page redrew the control | Usually retried automatically; add a short wait if it persists |
| Frame not found | The control is inside an iframe that is not there | Check the page state in the screenshot |
| Invalid selector | A typo in a locator | Fix it in Action Detail |
| Browser window/tab is not available | The tab was closed or the browser crashed | Check the step before it |
A failed check (an assertion, a visibility check, a network check) and an execution error (an exception, an API, database or mail problem, a configuration mistake) both show as ERROR in the live log. Assertions stop the test; a visibility check that fails marks its step and the test goes on. Each step type’s failure behaviour is in the step reference.
AI Analyze#
On a failed step of a dry run on your agent, AI Analyze inspects the live page and suggests locators. For this the agent keeps the browser open for up to 15 minutes after the failure. On the server the browser is always closed, so the analysis cannot read the page. It needs AI turned on for the project; see Turn on AI.
A dry run can repair locators for good
When all locators of a control fail, auto-heal looks for the control. If it finds it, the new locator is written to the action, used by every test case, and a review is created in Maintenance. The editor reloads the test case when you close the panel. Review healed actions in Maintenance.
What a dry run sends#
- The saved test case, with inactive steps left out and templates expanded into their steps.
- The values stored in the steps; for datasets, the first row. Pipeline parameter overrides are not used.
- The test case’s environment and start page; the project’s browser, engine and timeout settings.
- Retry count 0: a failed dry run is not retried.
Run modes: dry run, pipeline, agent#
A test case can run in two modes. An agent is not a third mode but a place where either mode runs. Every step type is built to work in all three situations: dry run, pipeline run on the server, and runs on an agent.
| Dry run | Pipeline run | |
|---|---|---|
| Started from | Dry Run in Automate | A pipeline in Schedule: by hand, on a timer, or from CI |
| Runs on | Web: the server or your own agent. Mobile: a local device or Device Farm. Desktop: a desktop agent. | The server, any agent the pipeline names, a self-hosted runner, or Device Farm |
| Live log | Yes | Yes |
| Report, All Logs, screenshots kept | No. Screenshots are deleted after 1 hour. | Yes, stored with the report |
| Tree status icon, Recent runs | Not updated | Updated |
| Dataset rows | First row only | One run per row when the execute count asks for it |
| Pipeline parameter values | Not used | Used |
| Retries | None: Retry Count is always 0 | The pipeline’s own Retry Count, copied from the project when the pipeline was created (details) |
| Can be stopped | No | Yes |
| Auto-heal | Yes | Yes |
When a test passes in a dry run but fails in a pipeline
Compare what differs: the pipeline’s parameter values, the dataset row, the run location (server or agent), the environment, and whether an earlier test case in the pipeline changed the data. A step that reaches a database or mail server works only where that server can be reached.
Limits#
| Item | Limit |
|---|---|
| Dry-run screenshots | Kept 1 hour (“Screenshot expired (kept for 1 hour).”) |
| Live-log buffer per run | 5,000 lines or 2 million characters, kept 30 minutes; 50 runs per project |
| One live-log message | 4,000 characters |
| Server queue | 20 waiting runs; beyond that “The test server queue is full. Please try again in a moment.” |
If something goes wrong#
- Dry Run is disabled
- “To perform a Dry Run, you need to have the Agent installed locally…”
- “Your agent appears to be offline…”
- “The test server queue is full…” or “…not reachable right now”
- “Appium server not found”
- The live log says Disconnected
- “Screenshot expired (kept for 1 hour).”
- The tree icon did not change after a dry run
Didn’t find your answer?Write to support with your project name and what you see on screen.
info@smartestqa.ai