- Docs
- Resources
- Agent Pool & Device Farm
- Nodes, devices & runs
Nodes, devices & runs
A node is a machine that connects phones and emulators to the Device Farm. This page covers the Nodes tab, the Devices tab with its device details, and the Recent runs list.
In short
On this page you can
- Add a device machine to the farm with Create Node and its install command.
- Spot unhealthy nodes: Offline, Draining or Check · Appium.
- Find an Available device by OS, version, brand, type, node or tag.
- Restart a device, toggle Wi-Fi or airplane mode, reset it to its baseline.
- Check recent farm runs, their minutes and device metrics.
How to use it
- Admins: Create Node, then Manage › Copy install command and run it on the machine.
- Wait until the node is Online and its devices appear in Devices.
- Open a device with Use device or Details.
- Take it live, install an app, or use the controls on the left of the screen.
- After a run, open Recent runs and the metrics icon of the row.
You need
The Device Farm right on your company’s licence and a MOBILE or DESKTOP project (What you see). Managing nodes and device controls need the Admin role (Who can do what).
Nodes#
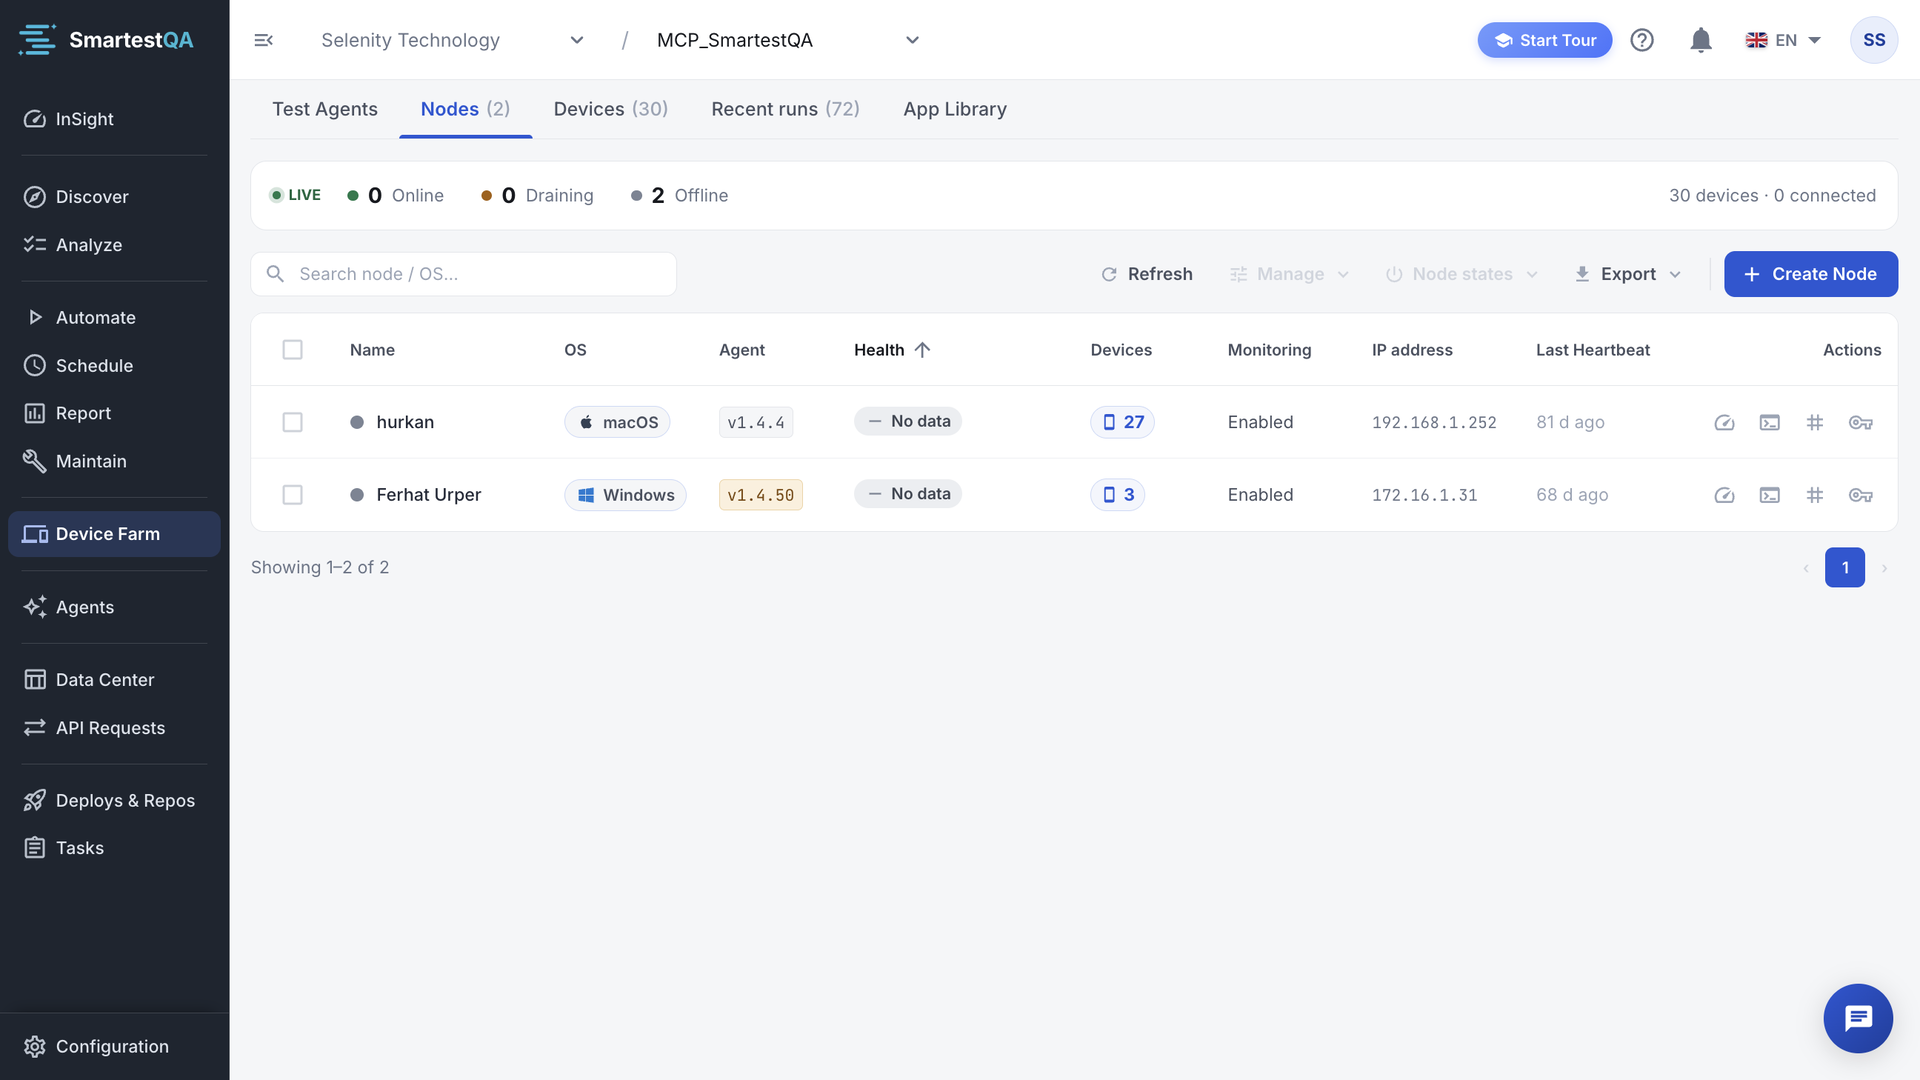
A node is a computer with phones or emulators attached. It runs the same SmartestQA client as a test agent, started with the node’s own API key, and reports its devices every few seconds. The Nodes tab lists your company’s nodes. Admins manage them; on-premise users can only look. Users of the cloud service do not see this tab.
Add a node#
Create Node
Click Create Node. In Enroll a new node type a Name and pick the OS: Linux (Android emulator + USB), macOS (iOS + Android) or Windows. Click Create.
“Node created — API key copied to clipboard”. The node appears as Offline.
Copy the install command
Tick the node, open Manage and click Copy install command. The command is built for the node’s OS and contains its key (“Install command copied to clipboard”).
Run it on the machine
Paste the command in a terminal on the node computer. Connect the phones by USB or start the emulators there.
The node turns Online, Last Heartbeat shows “just now”, and its devices appear in Devices.
Node names are unique within your company: a duplicate is marked while you type and gives “A node named “name” already exists in this company. Please choose a different name.” The key is not single-use; copy it again any time from the row’s More menu with Copy API key. Devices on a node your company owns are reserved for your company from the start.
The node list#
| Column | Shows |
|---|---|
| Name | Node name with a status dot: green Online, amber Draining, grey Offline. Admins can rename it in place. |
| OS | Windows, Linux or macOS. |
| Agent | The client version on the node, with “Up to date” or “Update available — latest is …”. |
| Health | Healthy, Check · API / Check · CDN / Check · Appium (that service does not answer on the node), or No data (node offline or no health report). |
| Devices | How many devices the node reports. Click to open Devices filtered to this node. |
| Monitoring, IP address | Whether monitoring is on, and the node’s address (copy icon). “—” when the node does not report it. |
| Last Heartbeat | “just now”, “n min ago”, “n h ago” or “n d ago”. See when a node goes Offline. |
Node actions (Admins)#
Tick one or more nodes (or Select all), then:
| Menu | Actions |
|---|---|
| Manage | Enable monitoring, Disable monitoring, Shut down emulators, Restart devices, Copy install command |
| Node states | Drain (maintenance): finish current work, take no new jobs. Resume scheduling: take jobs again. Restart node agent. Delete node. |
| Export | Node list (.xlsx), Selected nodes (.xlsx), Nodes + real devices (.xlsx) |
| More (row) | Node view (system, hardware, runtime versions, live charts and logs), Remote shell (ready actions only, such as listing devices or Appium status), Copy node ID, Copy API key |
Commands are queued and applied when the node next checks in. Delete node asks you to type delete: “The selected node(s) and their device records will be removed from the farm. This cannot be undone.”
Devices#
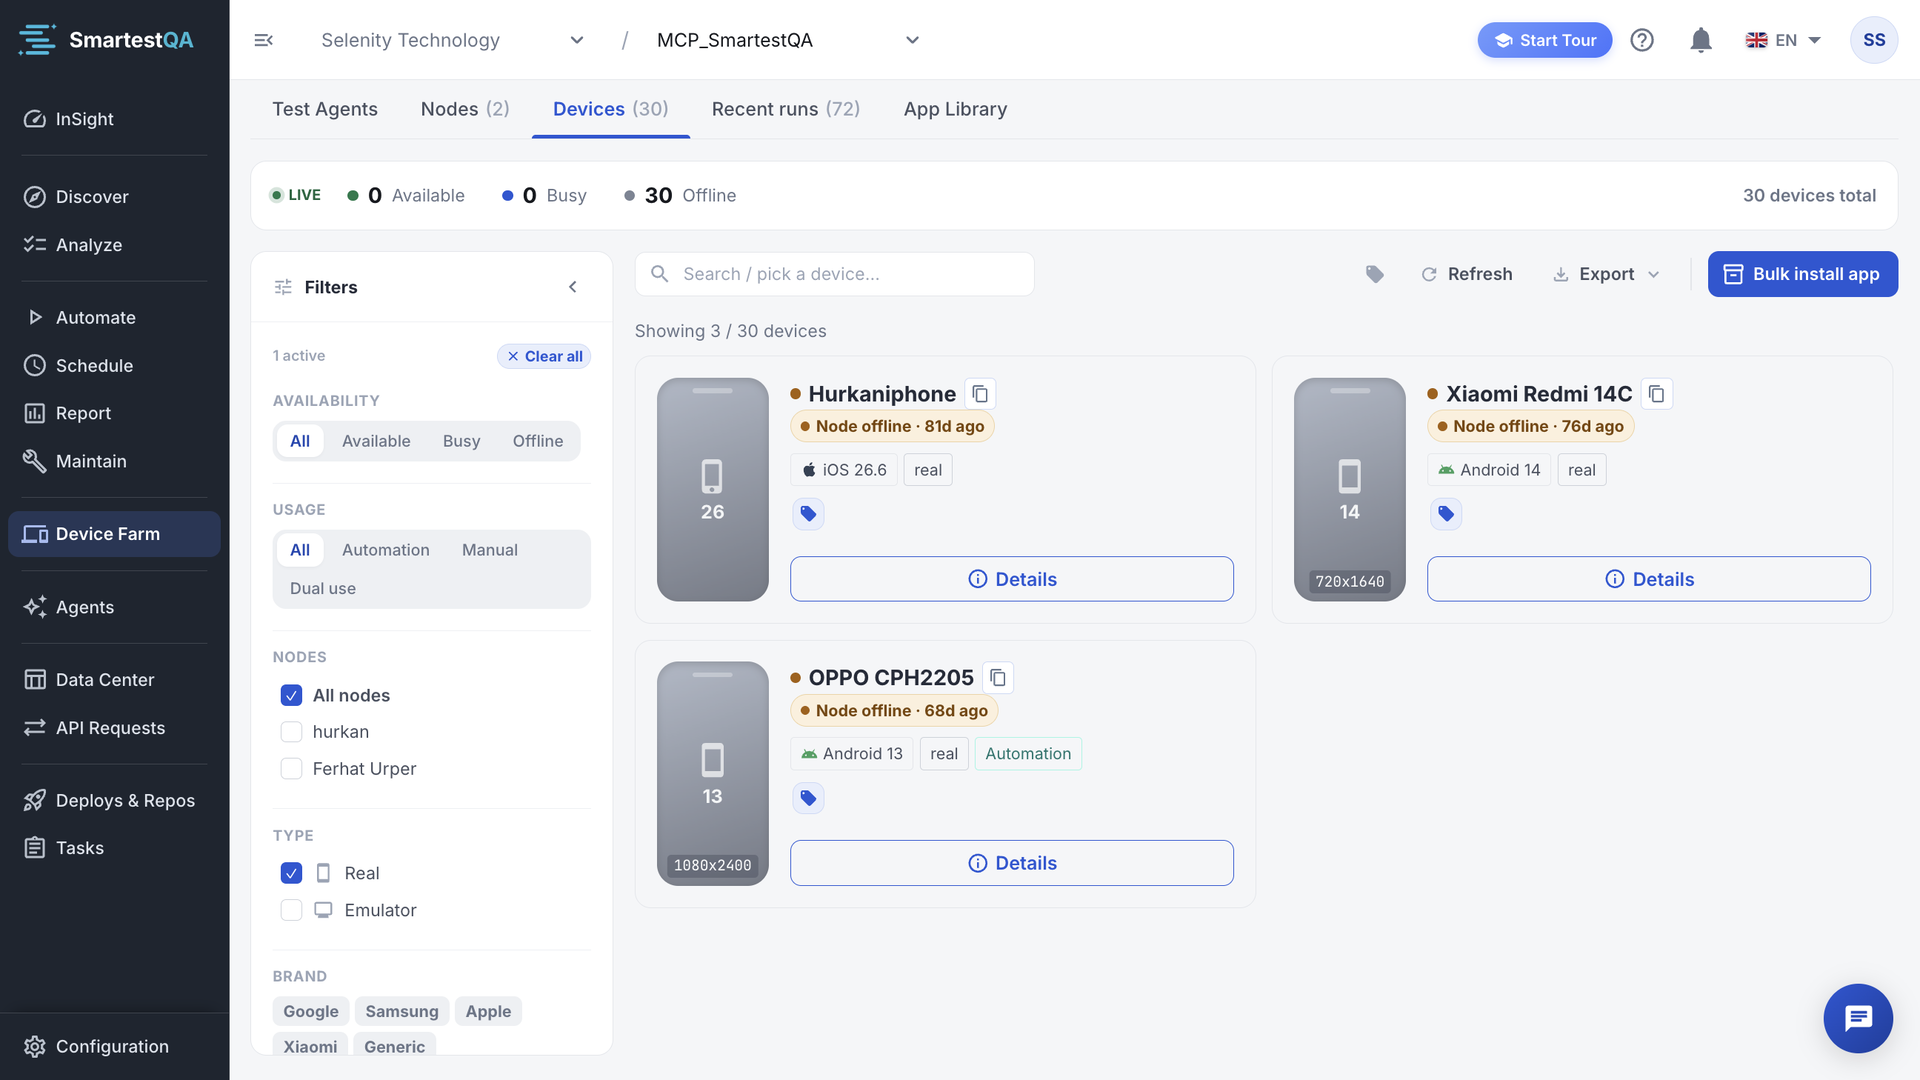
The Devices tab shows one card per device. Which devices you see depends on your role: admins and on-premise users see the devices on your company’s nodes; users of the cloud service see the devices your company may use (details).
Device states#
| State | Means | Can you take it? |
|---|---|---|
| Available | Online and free: “ready to take a session”. | Yes |
| Busy (pulsing dot) | A session holds it. The card says who: “You are using it right now”, “In use by a test run”, “In live use”, “In use by another customer”, or “User unknown”. | No |
| Offline | The node does not report the device any more (unplugged, emulator closed). | No |
| Node offline | The whole node stopped reporting; every device on it is unreachable. | No |
Offline devices are listed last. A small badge shows a restricted usage mode: Automation (“Marked for automation runs”) or Manual (“Marked for manual testing”). Devices without a badge are Dual use.
Find a device#
- The strip at the top counts Available, Busy and Offline devices and “devices total”.
- Search / pick a device... matches the name, model, UDID or node name.
- Filters (Show filters / Hide): Availability, Usage (All, Automation, Manual, Dual use), Nodes, Type (Real, Emulator), Brand, Operating system, OS version, Screen resolution. Clear all resets them.
- Filter by tags includes or excludes devices by tag. The same tags help you pick devices in other device lists; they are not sent to the run itself.
- Your filters are remembered in this browser.
- Export: Filtered results (.csv) or All devices (.csv). Refresh reloads the list.
Admins also have Bulk install app: pick an app from the App Library and the devices, then Install. See Install on devices.
Device details#
Use device and Details on a card open the full-screen device view. The phone frame on the left stays empty (“Screen not mirrored”) until you click Take device; that starts a live session.
- Holder: who has the device now (“You have this device”, a manual session, an automated run) or “nobody is using this device”.
- Device info: UDID, state, in use by, type, connection (USB, Wi-Fi (wireless ADB), Emulator (local)), network sharing, brand, OS, model, chipset, RAM, disk, resolution, battery health, usage mode, node, added, last run. Missing values show “—”. Export as CSV, JSON or text.
- Live metrics (temp/RAM/CPU) and Device logs (live Android logcat): admins and on-premise users. iOS devices have no logcat.
- Install App: install a build from the App Library on this device (admins and on-premise users).
Controls (Admins)#
| Control | What it does | Not available when |
|---|---|---|
| Restart | Restarts the device (“restart command queued”). | Busy or not reachable |
| Airplane mode, Wi-Fi | Turn the network on or off, for example to test how your app reacts to losing the connection. A dashed button means the current state is unknown; you can still choose on or off. | Offline; locked when USB tethering is active or the device is connected over wireless ADB, because switching would cut the node or the device off |
| Set as baseline | Saves the device’s current state as its clean starting point. | Busy |
| Reset to baseline | Returns the device to the saved baseline. | Busy, or “No baseline saved for this device yet” |
| Mark as automation / Mark as manual testing / Mark as dual use | Sets the usage mode. Only the two modes the device is not in are listed. Works while the device is offline. | — |
| Force release | Ends whatever holds the device and returns it to the pool. Shown when someone else holds it, or when it is Busy with “no active session found — the device is probably stuck”. | You hold it yourself |
Usage mode is a label for people and for automatic picking
Runs that pick a device automatically never take a Manual device. The mode does not stop anyone from taking a device live; it tells your team which devices to leave alone.
Recent runs#
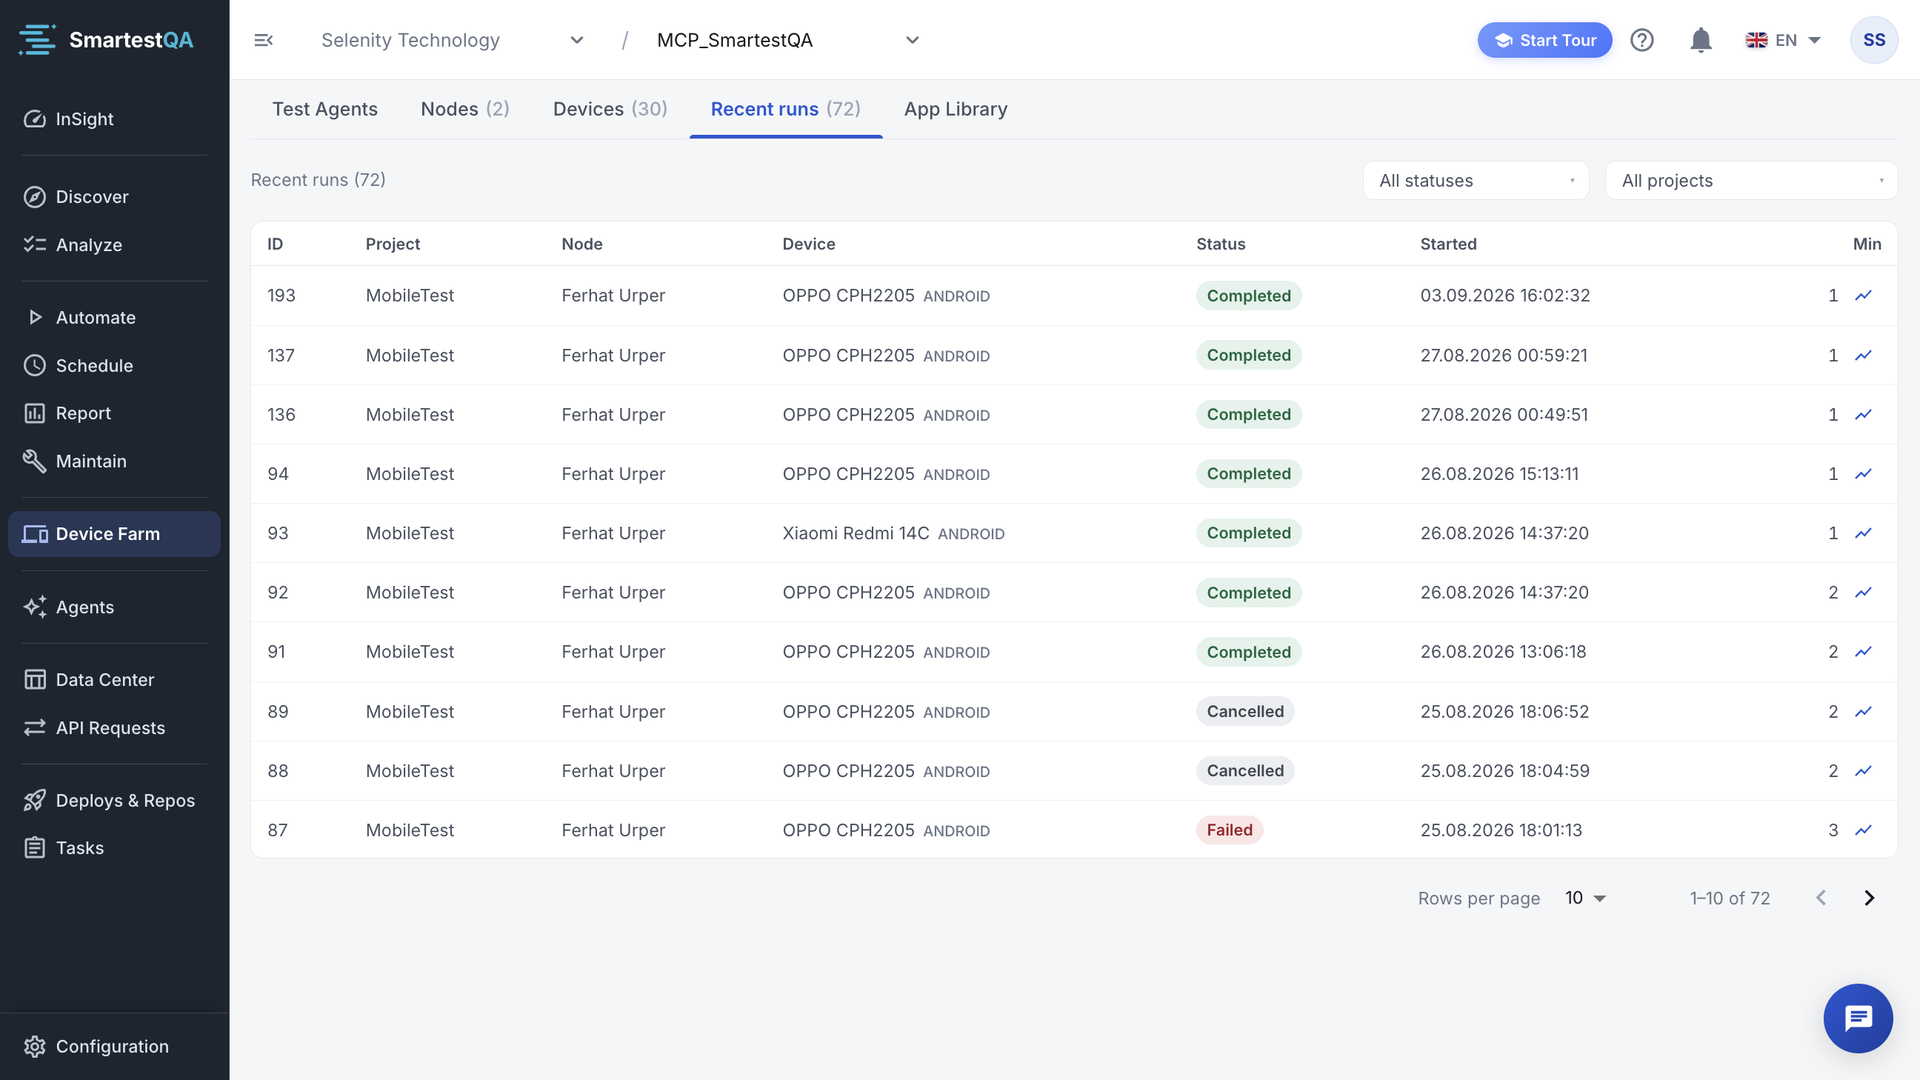
The Recent runs tab lists test runs on Device Farm devices, newest first. A row is added each time a test case or pipeline runs on a farm device.
| Column | Shows |
|---|---|
| ID | The run number. |
| Project | The project the run belongs to; “—” for older runs and in the view for users of the cloud service. |
| Node | The node that ran it (not shown to users of the cloud service). |
| Device | Device name and platform. |
| Status | Running, Completed, Failed, Cancelled, No show. |
| Started | Date and time in your browser’s format. |
| Min | Duration in minutes (how it is counted), and the metrics icon. |
- Filter by status (All statuses, Running, Completed, Failed) and, when runs have projects, by project (All projects). Clear all appears when filters hide every row.
- Show 10, 25, 50 or 100 rows per page. A new run flashes briefly when it appears.
- The list holds your company’s last 200 runs (“showing last 200”); users of the cloud service see the last 100 runs of projects they can open.
Device metrics of a run#
The metrics icon (“Device metrics (temp/battery/memory/CPU)”) opens Device Metrics with four charts: Temperature, Battery, Memory and CPU, each for the app and for the whole device where available. Emulators have no temperature or battery sensor (“Emulator — no sensor”). Metrics are collected for Android runs only; otherwise you see “No telemetry for this run”. How the values are read: Run telemetry.
Runs on farm devices are started from Automate (dry run on the Device Farm) or from a pipeline in Schedule; the app to install before the run is picked from the App Library there.
If something goes wrong#
Didn’t find your answer?Write to support with your project name and what you see on screen.
info@smartestqa.ai