Execution
The Execution tab answers “how did our runs go?” for a period you choose: the headline numbers with their change, each pipeline’s last runs, the failures grouped by cause, and the test cases that are flaky or slow.
In short
On this page you can
- Compare success rate, runs and failed runs with the period before.
- See the last 14 runs of every pipeline and when each runs next.
- Group failed steps by error into Failure clusters and see their cause.
- Find Flaky scenarios and Slowest scenarios.
- Download the period as Excel, or print it as PDF.
How to use it
- Open InSight › Execution and choose the Period (default Last 7 days).
- Check Run environment: agents online, no stuck runs.
- Read the six cards; a red change means worse than the previous period.
- Work down Failure clusters from the top; click Open scenario or Copy MCP prompt.
- Click Download for the weekly status report.
Period, refresh and download#
The tools sit on the right of the tab row.
- Period: Today, Yesterday, Last 7 days (default), This week, Last week, Last 30 days, This month, Last month, Last 90 days or Custom range (From, To, Apply). Weeks start on Monday. The choice is remembered in this browser. At most 365 days.
- Live chip: how old the numbers are. They are calculated when the tab opens and when you click Refresh.
- Download: Excel or PDF.
Every number is compared with the period of the same length just before. For Last 7 days on 14 November, that is 1–7 November. How windows work: Period and comparison.
Run environment#
The first row explains most “nothing ran” mornings. It always describes now, not the chosen period.
| Item | Means | Do |
|---|---|---|
| “Agents {on} / {total} online” | Your company’s agents, green when at least one is online, red when none is. | Start the agent; see Install an agent. |
| “No stuck runs” / “{n} runs stuck in RUNNING” | Test case runs still Running more than 2 hours after they started (last 30 days). “They usually mean the runner died and the result never came back.” | Open them in Report, stop them, check the agent. |
| “Last run {date}” | When the project’s newest run started. | — |
| Agent pool | Opens Device Farm › Test Agents. | — |
When auto-heal repairs wait for review, the same row says so, with Review.
The six summary cards#
Each card shows the value for the period and, below it, the change against the previous period: green when it got better, red when it got worse, grey when it did not change or has no better direction (Runs). Success rate, Runs and Failed runs also have a small trend line of the last 8 weeks.
| Card | Hint in the app | Formula |
|---|---|---|
| Success rate | “Finished scenario runs that passed in the selected period. The change is against the {n} days before.” | Success rate |
| Runs | “Pipeline runs plus single scenario runs in the selected period.” | Runs |
| Failed runs | “Runs with at least one failed scenario.” | Failed runs |
| Flaky scenarios | “Scenarios that flip between pass and fail (score ≥ 0.2 over at least 5 runs).” | Flaky score |
| Average run time | “From the first scenario’s start to the last one’s end, per run.” | Average run time |
| Time saved | “Assumption: each executed step of a passing scenario would take 30 s by hand; the automation’s own run time is subtracted.” | Time saved |
Durations show as 45 s, 4 min 12 s or 1 h 5 min; time saved as {n} h. A dash means there is nothing to measure.
Pipeline run strip#
“Last 14 runs of each pipeline, oldest to newest. Failed and most recent first.” One row per pipeline; click it to open the pipeline in Schedule.
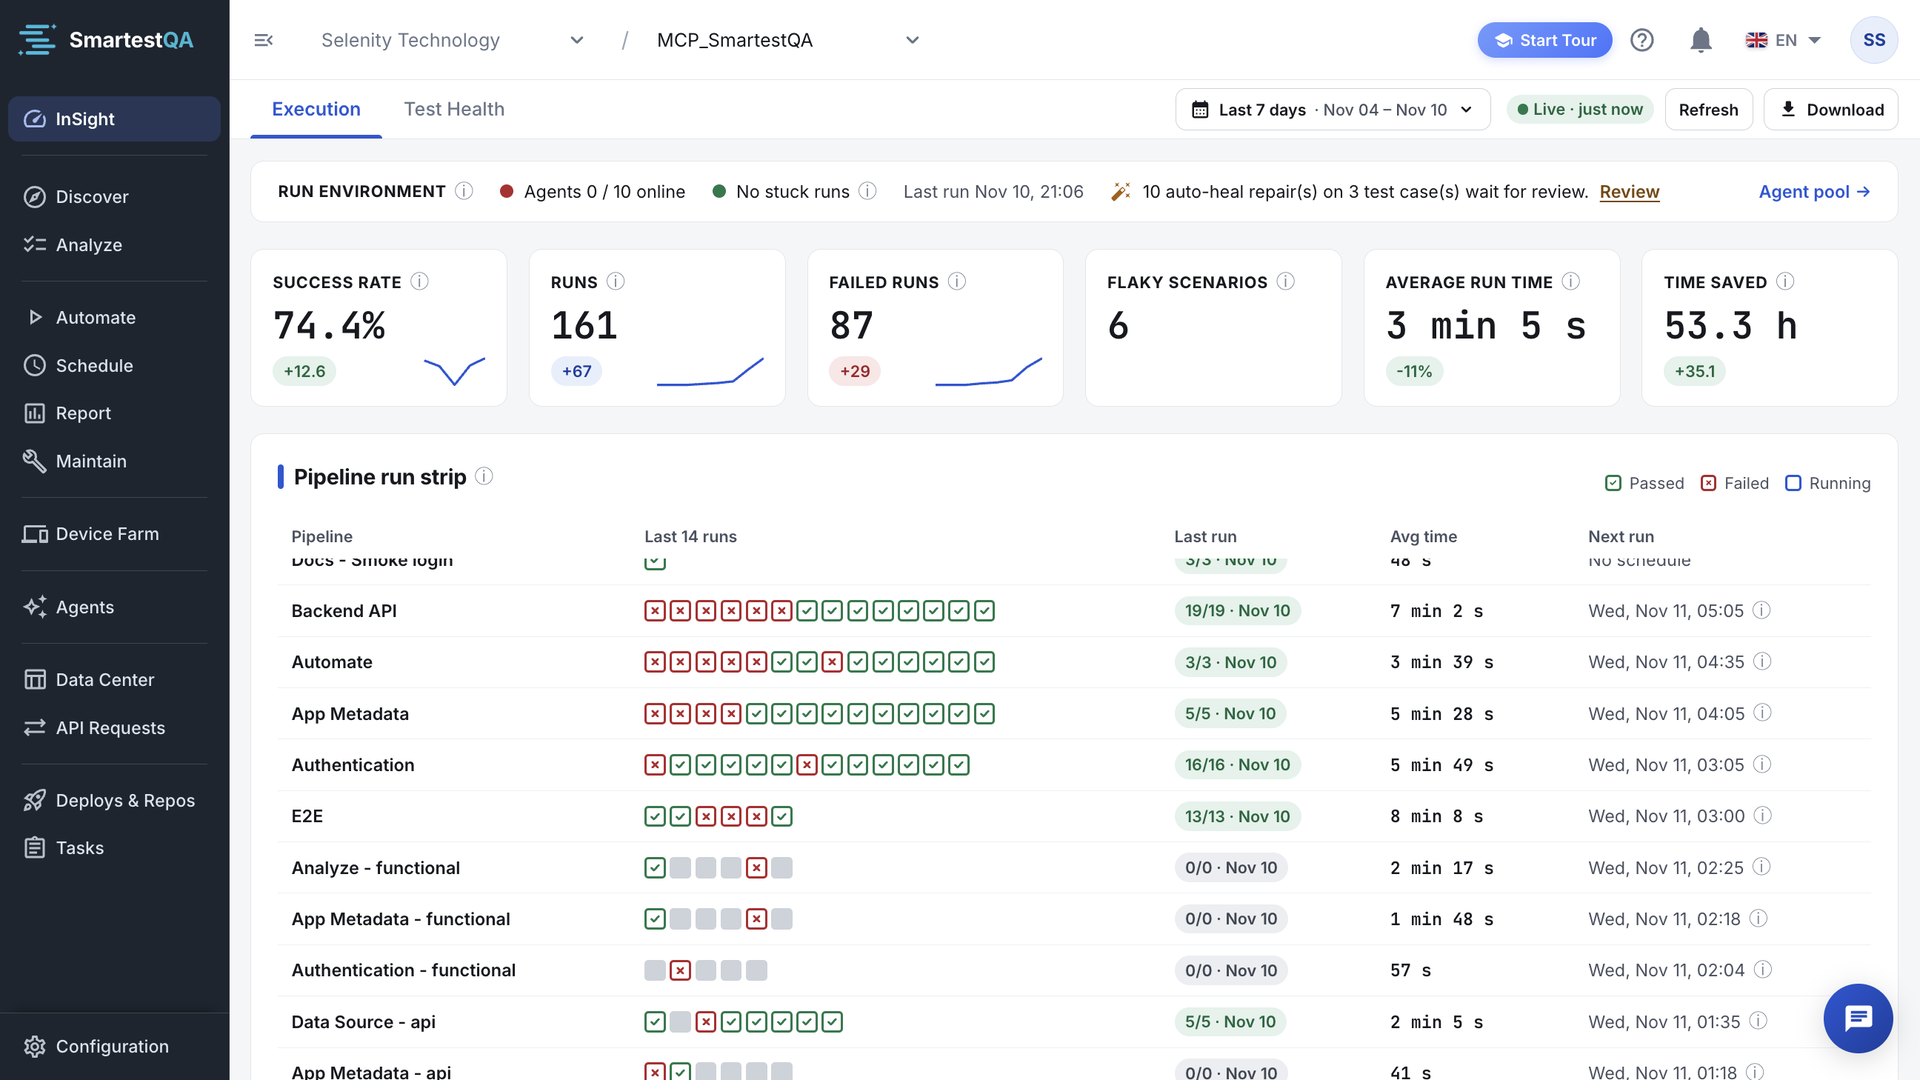
| Column | Shows |
|---|---|
| Pipeline | The pipeline name. |
| Last 14 runs | One mark per run: Passed, Failed, Running, or neutral when it neither passed nor failed. Hover a mark for its date and passed/total. |
| Last run | Passed/total test cases and the date of the newest run, or Never ran. |
| Avg time | Average duration of the runs shown. |
| Next run | The next timed start (hover for the schedule rule), the schedule type (Daily, Weekly, Monthly, Custom), Ended when the schedule’s end date has passed, or No schedule. |
The strip looks back at least 56 days whatever the period, so a nightly pipeline always shows its last two weeks. Pipelines with no run in that time and no active schedule are left out. How a mark’s colour is decided: Strip marks.
Failure clusters#
“Failed steps grouped by the same error message (numbers and values ignored). Biggest first.” Ten test cases failing with “Expected 3 items but found 0” and “Expected 5 items but found 0” are one cluster.
Each cluster card shows:
- A cause chip: Assertion, Locator, Environment, API or Other (see Causes).
- The error’s first line, or No error message.
- “{cases} scenarios · {failures} failures · {pipelines} · first {date}, last {date}”.
- Open scenario: opens one of its test cases in Automate.
- Copy MCP prompt: copies a task for your AI assistant: find the root cause, say whether it is a product bug or a test problem, fix the test if it is the test.
The card shows the six biggest open clusters; + {n} more opens all of them (up to 100) in a dialog.
Fixed clusters#
A cluster is Fixed when “Every scenario in this group passed in a later run after its last failure.” Fixed clusters are hidden. Show fixed ({n}) adds them to the list, Hide fixed removes them; the choice is remembered in this browser. When everything in the period was fixed: “No open failures. The failed steps in this period were fixed in later runs.” The exact rule: Clusters and Fixed.
Causes, action types and pages#
Next to the clusters, three cards break the failures down.
| Card | Counts |
|---|---|
| Causes | “One cause per failed scenario run, guessed from the error message.” A stacked bar plus a count per cause. Hover a cause for its meaning. |
| Failures by action type | The action type of the failed steps (Click, Type, Get…), top 6. |
| Pages with most failures | The page of the failed steps, top 6. Pages are the ones you named in Discover. |
| Cause | Meaning in the app |
|---|---|
| Assertion | “The step compared a result and it did not match. Could be a product bug or a wrong expectation.” |
| Locator | “The element was not found, not visible or not clickable. Usually the page changed.” |
| Environment | “Connection, agent, browser or session problems — not the product’s behaviour.” |
| API | “An API call returned an unexpected status or body.” |
| Other | “The message did not match a known pattern.” |
Flaky scenarios#
“Score = how often the result flips between runs (0 stable, 1 flips every time). Below 5 runs it is uncertain.” Only test cases with at least one pass and one fail in the period are listed, at most 10.
| Column | Shows |
|---|---|
| Scenario | The test case. Click the row to open it in Automate. |
| Score | 0.00–1.00: green below 0.2, amber from 0.2, red from 0.8. Under 5 runs: “uncertain · {n} runs”. |
| Last 10 | The last ten results as pass and fail bars, oldest left. |
| MCP | Copies a prompt that asks your assistant to compare passing and failing runs and make the test stable. |
Formula and example: Flaky score. Report shows the same instability per run as Passed on retry.
Slowest scenarios#
“Run time of finished scenario runs in this period.” The eight test cases with the highest p95.
- p50: half of the runs were faster than this. p95: 95 of 100 were faster.
- Change: “p95 against the previous period of the same length.” Red above +10%, green below −10%, grey in between, a dash with nothing to compare.
Formula: Slowest scenarios.
Results by requirement#
“Sub-requirements whose scenarios ran in this period. Riskiest and weakest first.” Up to 10 rows; click one to open it in Analyze.
| Column | Shows |
|---|---|
| Sub-requirement | Its name, with its main requirement under it. |
| Risk | CRITICAL, HIGH, MEDIUM or LOW: its own severity, else its main requirement’s. |
| Scenarios | Test cases linked to it. |
| Success rate | Passed share of its test cases’ runs in the period: green from 90%, amber from 60%, red below. |
| Status | Passed when every linked test case passed its last run, Failed when one failed, Not run otherwise. |
Open tasks#
“Tasks that are not closed, resolved or done. "From runs" are the ones opened from a test run.” Three numbers: open (all time), new in {n} days (opened in the period and still open) and from runs. Below them, the six newest open tasks with their number and creation date; click one, or Go to tasks.
Weekly trend#
“Last 8 weeks: bars are runs, the line is the success rate.” Each week is seven days ending on the same weekday as today, so the last bar ends today. It does not follow the period: use it to see whether this week is normal.
Download Excel or PDF#
Pick the period
The download contains what the tab shows for the chosen period.
Click Download
Choose Excel (.xlsx), “One sheet per section, for the selected period”, or PDF, “Print or save as PDF”.
Excel: a workbook with the summary (value, previous period, change), run environment, pipelines, clusters, weekly trend, flaky and slow test cases, requirements and tasks. PDF: your browser’s print dialog with only the Execution content, A4 landscape, headed “SmartestQA · Execution · {from} – {to}”.
If the workbook cannot be built you see “The file could not be created.”
Empty and error states#
- “No runs in this period”: “Run a pipeline or a scenario and the results show up here.” with Open pipelines and Show the last 90 days.
- “Execution could not be loaded”: “The server did not answer. Try again in a moment.” with Try again.
- Cards without data say so: “No pipeline ran in this period.”, “No failed steps in this period.”, “No flaky scenario in this period.”, “No timing data.”, “No requirement-linked scenario ran in this period.”
Classic view#
Adding ?classic=1 to the InSight address (/dashboard/default?classic=1) shows a different Execution layout with its own date filter (default This week):
- Five cards: Defects by Automation, Time Saved, Auto-Heal Actions, Executions, Success Rate.
- Requirements Summary, Error Test Steps, Pages with Most Errors, Tasks List.
- User Statistics: test cases created and pending tasks per user.
- Action Performance Metrics and the Weekly Metrics Dashboard (test cases, requirement score, coverage, success rate per week).
Its numbers are counted differently from the tabs above, for example its success rate is per step, not per test case run. See Classic view numbers. Test Health is not affected.
If something goes wrong#
Didn’t find your answer?Write to support with your project name and what you see on screen.
info@smartestqa.ai